Interest rate risk is scaring investors away from longer maturity bonds. And this is the case regardless of issuer quality – whether’s it high-quality U.S. government Treasury bonds, or low-quality emerging market debt. Given today’s low interest rates, long-term bonds are simply out of fashion. Whatsmore, investors are outright fearful of long-term bonds.
This is especially the case for bonds that pay less – like high-quality U.S. Treasury bonds. The relatively smaller coupon provided by Treasury bonds – relative to higher-paying bonds issued by less creditworthy entities – can keep investors away.
Why are long-term Treasury bonds so scary?
Two Factors Dictating the Returns of Long-Term Treasury Bonds: Stock Market Performance & Interest Rate Movements
The value in long-term Treasury bonds is their crisis alpha. This means that when U.S. equity markets decline, the value of long-term Treasury bonds increases – more so than most other asset classes – and more so than other fixed income asset classes. (I’m speaking here on average. There are always exceptions.)
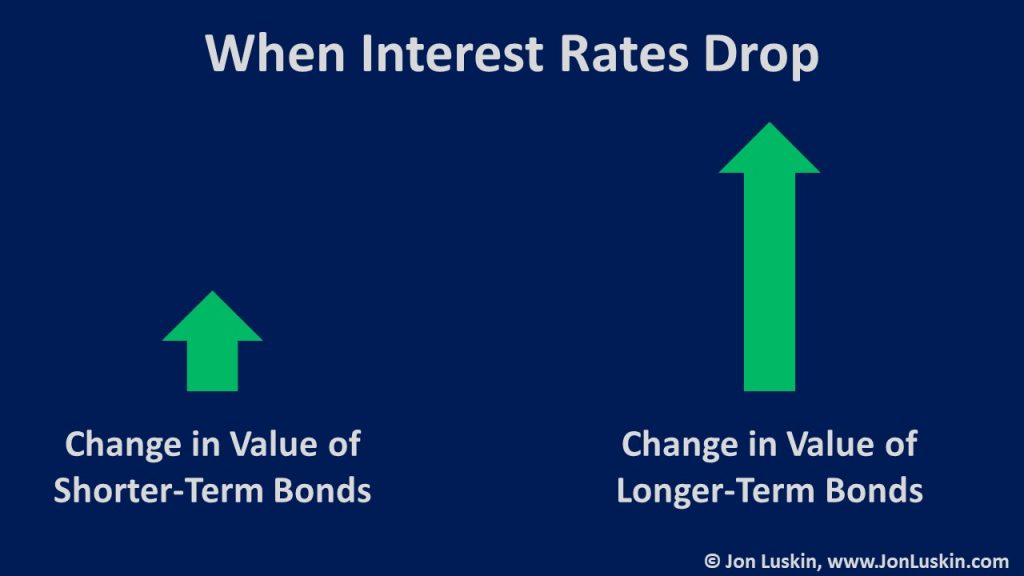
Also interesting about long-term Treasury bonds – and long-term bonds: interest rate risk is a double-edged sword. If rates increase, the value of the bond drops by a relatively larger amount (compared to shorter-maturity bonds). But, if interest rates decrease, the value of the bonds increases proportionally in the opposite direction.
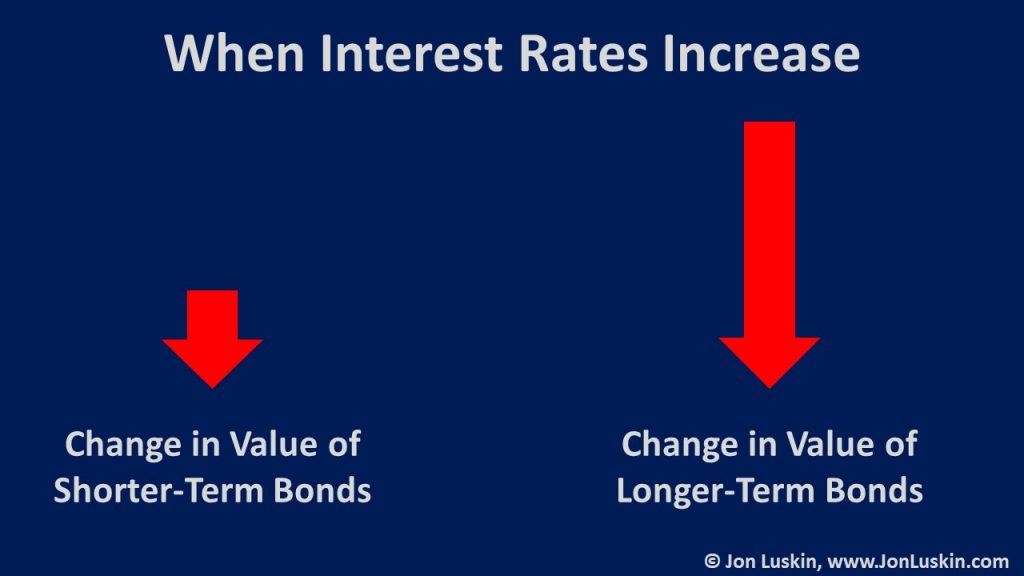
This is doubly interesting the Federal Reserve’s common salve is to lower interest rates when markets drop. When that happens, not only do long-term Treasury prices increase because they are the safe-haven that investors flock to – but long-term Treasury prices increase from the interest rate change because of their extended maturity.
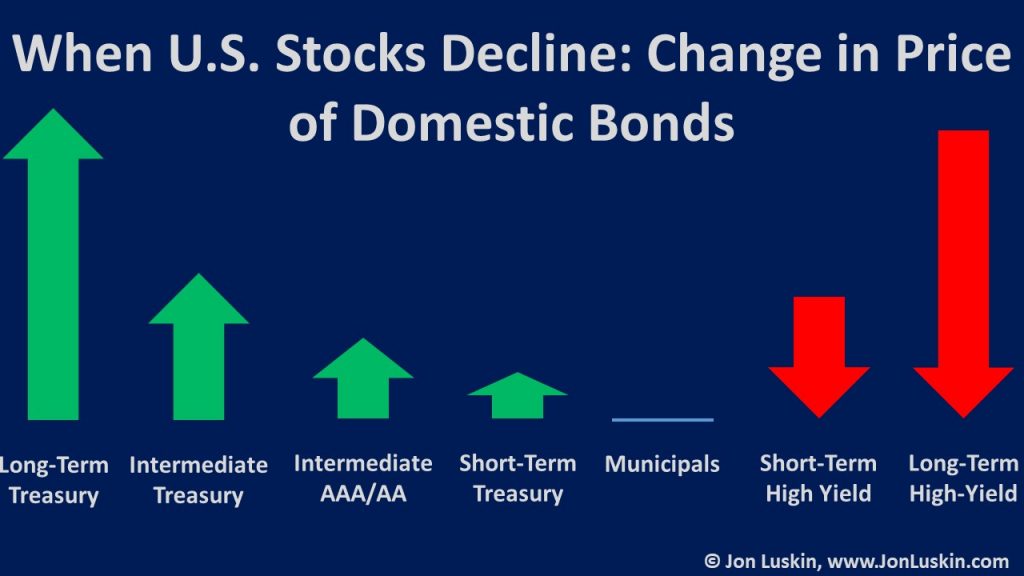
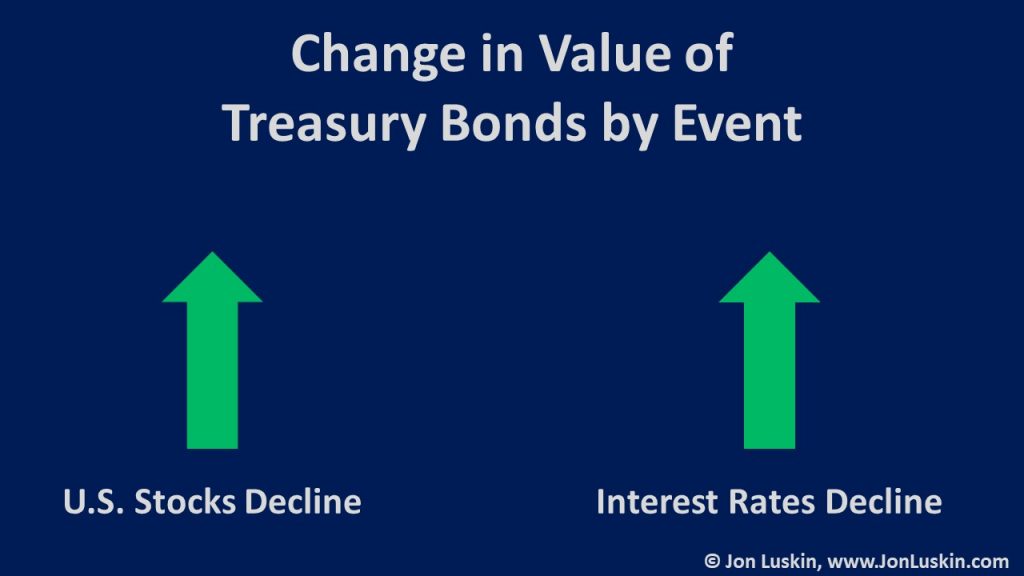
This sequence of events – benefiting holders of long-term Treasury bonds looks like this:
- U.S. equity markets decline.
- Panicked investors buy U.S. Treasury bonds – driving up the price of U.S. Treasury bonds. The value of long-term Treasury bonds increases because they are Treasury bonds – the safe investment.
- The Federal Reserve decreases interest rates to stimulate the economy.
- Falling interest rates drive up the price of bonds. Longer-term bonds see the most significant price increase. Here, the price of long-term Treasury bonds sees a further increase because they are long-term bonds.
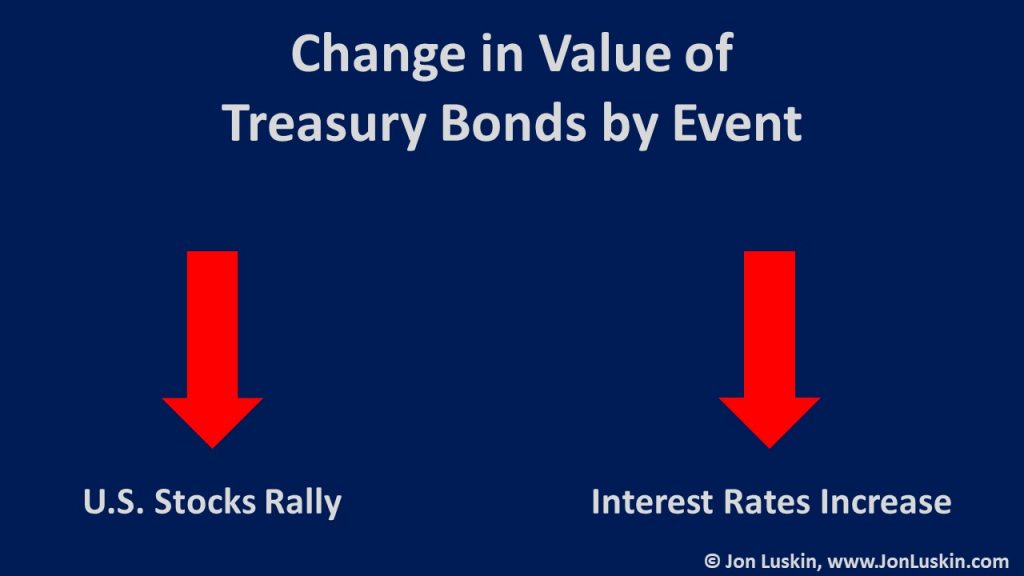
Naturally, a rising market coupled with an increase in interest rates has the opposite impact. With a soaring stock market, investors drop Treasury bonds. Total returns on Treasuries are impacted. And, with a soaring stock market, the Federal Reserve can be known to increase interest rates (to cool the economy). An increase in interest rates decreases the returns of those holding long-term bonds. The sequence of events looks like this:
- U.S. equity markets rally.
- Investors dump the safe-haven investment that is U.S. Treasury bonds – driving down the price of U.S. Treasury bonds. Here, the price of long-term Treasury bonds decreases because they are then-unfashionable Treasury bonds. Those holding long-term Treasury bonds see a price decrease of their bonds.
- Federal Reserve increases interest rates to cool the economy.
- Increasing interest rates lower the price of bonds. Longer-term bonds see the most significant price decrease. Here, the value of long-term Treasury bonds sees a noteworthy decrease because they are long-term bonds.
Of course, this isn’t all terrible. The above are certainly rebalancing opportunities. Who doesn’t like buying low and selling (relatively) higher?
Measuring the Value of Long-Term Treasury Bonds
It’s clear that long-term Treasury bonds can change prices based on market movements and interest rate movements. The question remains:
Are long-term Treasury bonds worth holding?
To answer this question, let’s consider a hypothetical portfolio. (Enough exposition! Let’s crunch some numbers!) Since long-term U.S. Treasury bonds are a relatively aggressive investment (next to T-Bills), it may be appropriate to model this experiment with a relatively aggressive portfolio: 80% stocks and 20% bonds. (See other notes on data & methodology here.)
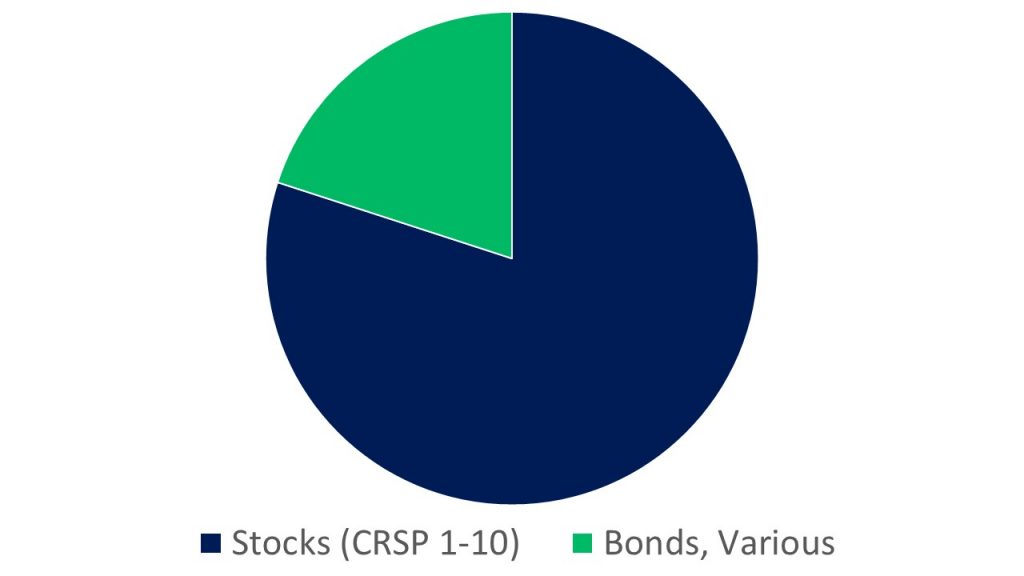
Risk & Return of Portfolios Holding Various Bonds, 1926-2020
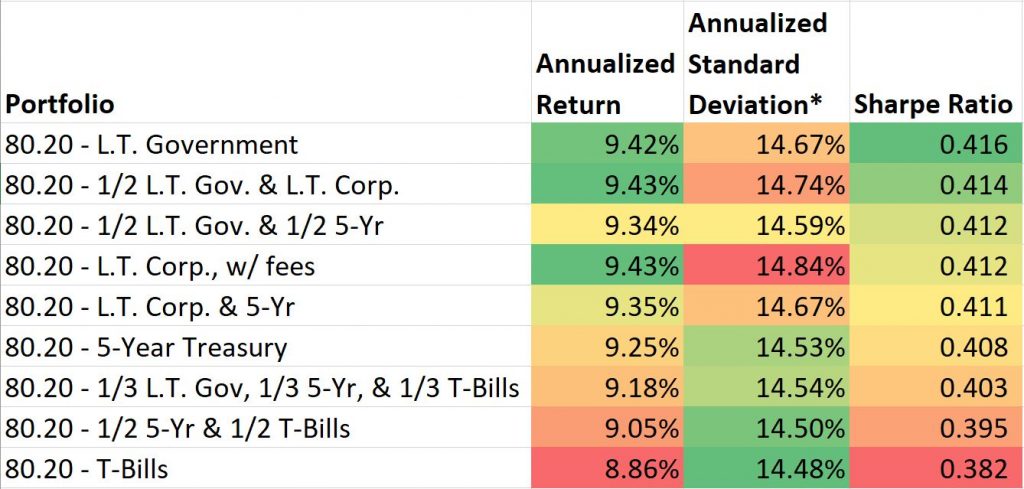
Below is the performance for various portfolios running from 1/1/1926 – 2/29/2020, with the bond allocation varying. Results are sorted by Sharpe Ratio.
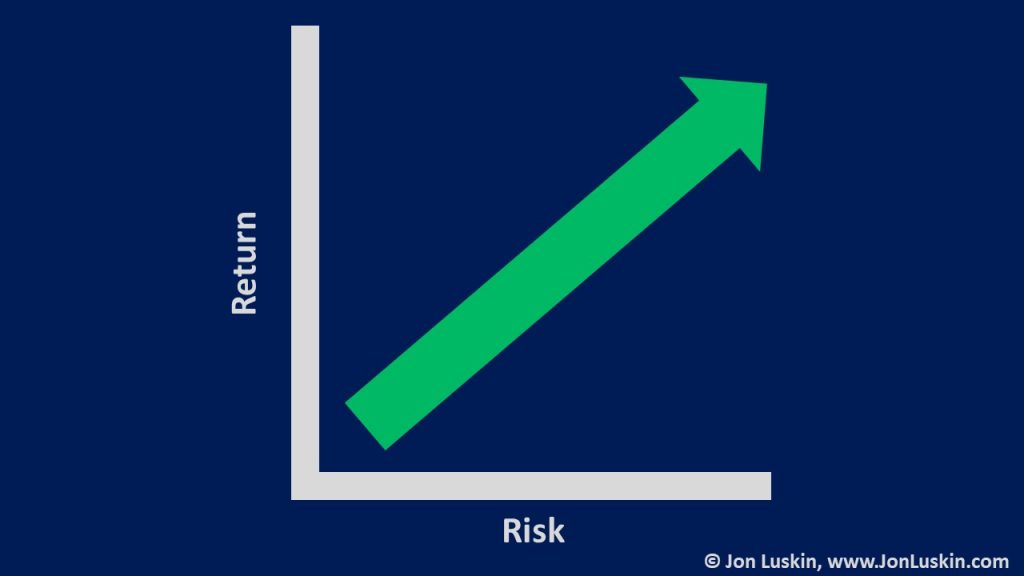
I should come as no surprise that the basic tenant of investing holds:
Greater return is had by enduring greater risk.
The riskiest portfolio – holding corporate bonds shows the highest return and the highest risk – as measured by standard deviation. Similarly, as the term of U.S. Treasury bonds increases, as does both the return and the standard deviation of the portfolio; as issuer quality increased from corporates to Treasuries, portfolio risk decreases. As bond maturity shortens, portfolio risk further decreases.
Using the Sharpe Ratio to the Measure the Performance of Long-Term U.S. Treasury Bonds
The Sharpe ratio – using One-Month US Treasury Bills as the risk-free rate – may illuminate if that increased risk warrants the increased return. And the answer is: perhaps just barely. That is, the difference in the numbers is relatively small; it may be too close to call. But, if you’re really getting down the tiny differences, the portfolio holding only long-term Treasury treasury bonds marginally outperforms.
In fact, the difference in the numbers is so small, that it may be problematic to assume the same results in the future. After all, if future performance were only slightly different, the best-performing investment could very well change.
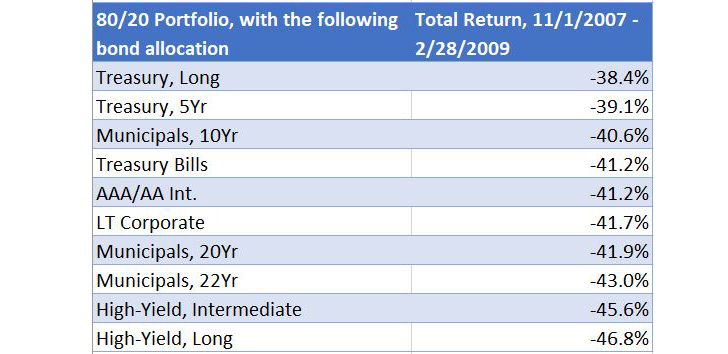
Financial Crisis Performance of Various Bond Indices
See the table below. The portfolios more heavily laden with longer-term Treasuries marginally outperformed those portfolios holding other bonds. Note that these portfolios were rebalanced annually.
Rising Interest Rate Environment
An extreme historical example is November 1938 through June 1981. During that time, average short-term term interest rates dropped by an amount greater than in any other period (given the available data). The results are below:
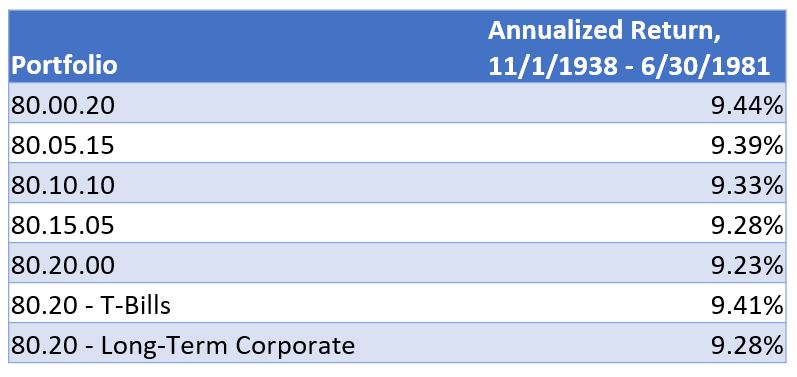
Once again, the difference in the numbers is startlingly small. In this instance, a portfolio with intermediate-term Treasury bonds did better, but not as good as a portfolio holding just T-Bills for bonds. Obviously, holding longer-term bonds in a period of interest rate declines is not ideal for one’s investment returns.
Are Long-Term Treasury Bonds Worth Holding?
To summarize, the differences in the numbers are small. Arguably, the data is inconclusive. Given the above, I’m not able to vehemently say what the best solution is.
Unexpected Inflation
Perhaps the greatest risk with any long-term bond is unexpected inflation. Look no further than the 1980s in the United States as an example. (Likely, inflation is why Swensen suggests a combination of both nominal U.S. Treasury bonds and TIPS, with Swensen suggesting intermediate duration nominal U.S. Treasuries.)
One compromise is to hold a token long-term Treasury bond allocation in one’s portfolio. This will allow the bondholder to earn an interest rate premium over shorter-term Treasuries (at least when there is a normal interest rate curve) and benefit from the characteristics of long-term Treasuries outlined above – their superior crisis alpha. #diversification
What is the optimum allocation for this token holding? Absent a decline in interest rates, more is better. But, if the “more is better” approach was taken with all asset classes, then all portfolios would be 100% U.S. small value. Once again, I do not know if there is a right answer.
Data, Methodology & References
Hypothetical investment portfolios were constructed using historical data. Stocks were represented by CRSP 1-10. Bonds were represented by one-month, five-year Treasuries, and long-term U.S. government bond indices, a long-term corporate bond index, an intermediate-term corporate bond index (AAA/AA), an intermediate-term high-yield index, and a municipal bond index. All coupons, dividends, and capital gains were reinvested. Portfolios were rebalanced on each calendar year. There was no consideration for transaction costs, other fees, or taxes. Risk was measured by calculating the standard deviation of the entire portfolio.
CRSP Deciles 1-10 Index (market): Source: CRSP, total returns in USD; Jul 1962 – Present : CRSP Deciles 1-10 Cap-Based (Market) Portfolio; Rebal. Quarterly – All Exchanges; CRSP Market Index-Weighted average of CRSP 1 through CRSP 10; Jan 1926 – Jun 1962: NYSE, Rebalanced Semi-Annually
CRSP data provided by the Center for Research in Security Prices, University of Chicago.
Long-Term Government Bonds: Total Returns in USD; January 1926 – Present: Long Term Government Bonds; Source: Morningstar; Former Source: Stock, Bonds, Bills, And Inflation, Chicago: Ibbotson And Sinquefield, 1986; Mutual fund universe statistical data and non-Dimensional money managers’ fund data provided by Morningstar, Inc.
Treasury bonds were represented by Morningstar’s U.S. Long-Term Government Bond Index. This index holds Treasury and U.S. government agency bonds with maturities of seven years or longer. At times, the index holds 3.45 percent U.S. government agency debt. Ideally, a pure long-term Treasury index would be used; however, such data going back to 1926 was not available.
Five-Year US Treasury Notes: Total Returns in USD; January 1926 – Present: Five-Year US Treasury Notes; Source: Morningstar; Former Source: Ibbotson Intermediate; Five Year Treasury Notes; Mutual fund universe statistical data and non-Dimensional money managers’ fund data provided by Morningstar, Inc.
One-Month US Treasury Bills: Total Returns in USD; January 1926 – Present: One-Month US Treasury Bills; Source: Morningstar; Former Source: Stocks, Bonds, Bills, And Inflation; Chicago: Ibbotson And Sinquefield, 1986; Mutual fund universe statistical data and non-Dimensional money managers’ fund data provided by Morningstar, Inc
Long-Term Corporate Bonds: Total Returns in USD; January 1926 – Present: Long-Term Corporate Bonds; Source: Morningstar; Former Source: Stocks, Bonds, Bills, And Inflation; Chicago: Ibbotson And Sinquefield, 1986; Mutual fund universe statistical data and non-Dimensional money managers’ fund data provided by Morningstar, Inc.
Corporate bonds have been shown to have higher trading costs then the more liquid United States Treasury bonds. As per a previous study, six basis points (0.06%) was apportioned on the 20% bond allocation to account for this increased trading costs.
FTSE US Broad Investment-Grade Corporate Bond Index AAA/AA 3-7 Years: February 1980 – Present: FTSE US Broad Investment-Grade Corporate Bond Index AAA/AA 3-7 Years; Total Returns in USD; Source: FTSE; FTSE fixed income indices © 2020 FTSE Fixed Income LLC. All rights reserved.
Bloomberg Barclays U.S. High Yield Bond Index Intermediate: July 1983 – Present: Bloomberg Barclays U.S. Intermediate High Yield Bond Index; November 2008 – August 2016: Barclays High Yield Composite Bond Index Intermediate; July 1983 – October 2008: Lehman Brothers High Yield Composite Bond Index Intermediate; Total Returns in USD; Maturity: 1-10 Years; Source: Bloomberg; Bloomberg Barclays data provided by Bloomberg Finance L.P.
Bloomberg Barclays Municipal Bond Index 10 Year: January 1980 – Present: Bloomberg Barclays Municipal Bond Index 10 Years
November 2008 – August 2016: Barclays Municipal Bond Index 10 Years
January 1980 – October 2008: Lehman Municipal Bond Index 10 Years
Total Returns in USD; Source: Bloomberg; Bloomberg Barclays data provided by Bloomberg Finance L.P.
Leave a Reply