Alternative investments are investments that are not stocks, bonds, or cash. The list of alternatives is endless: real estate, hedge funds, private equity, venture capital, timberland, fine art, farmland, reinsurance, private lending, and more.
Alternatives are often pitched as a magical way to diversify an investment portfolio. They are said to be immune from the same shocks that impact the stock market. Of course, that’s a story. Endowments heavily invested in alternatives saw their portfolios plummet during the financial crisis of 2007–2008. Without the touted benefit of diversification – but with high fees, it’s clear that investors are generally best off by shunning alternatives.
Unfortunately, countless financial professionals haven’t gotten the memo, and are still investing client money into high-fee alternatives. In this post, we’ll bust the diversification myth of alternative investments. To nerd out on why people (even financial professionals) mistakenly assume that alternatives offer diversification, read on.
Cor>Correlation, Liquidity, & Volatility
To clarify the misunderstanding about the value of investing in alternatives, we’ll dive into three technical investing principles: correlation, liquidity, and volatility.
What Is Correlation?
Correlation is a way to measure diversification. Correlation measures the degree to which two investments mirror each other’s movements. If two investments increase in value simultaneously, they are correlated.
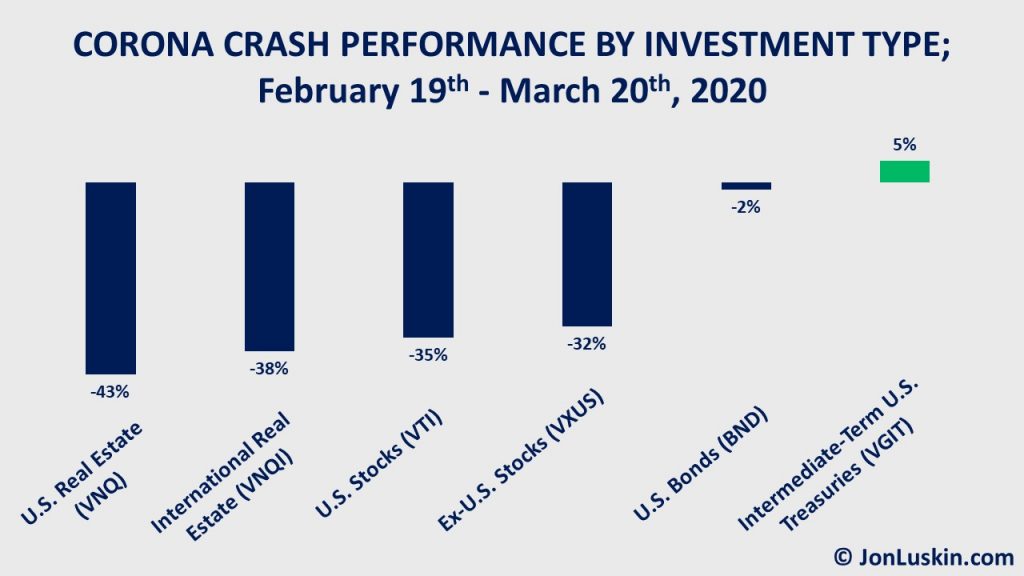
Look at the performance of different investments during the 2020 coronavirus crash. Stocks and real estate (the latter expressed as publicly-traded REITs) lost value. Therefore, stocks and real estate are very correlated. Treasuries moved in the opposite direction from stocks, making Treasuries an excellent tool for managing risk.
Not shown above are private REITs. Yet, publicly traded and private REITs are also correlated. Yet, since private REITs aren’t publicly traded, we don’t see the correlation. This is because private REITs are illiquid.
What Is Liquidity?
Liquidity is the speed at which you can sell something. The faster you can sell something, the more liquid it is.
For example, the cash in your bank account is very liquid. You can access that money as quickly as you can swipe your debit card. The tickers listed in the graph above represent exchange-traded funds (ETFs), which are also very liquid. You can sell an ETF within seconds during market hours.
On the other side of the liquidity spectrum is your house, which is not liquid at all. Even in the best of circumstances, it would take days to sell your house.
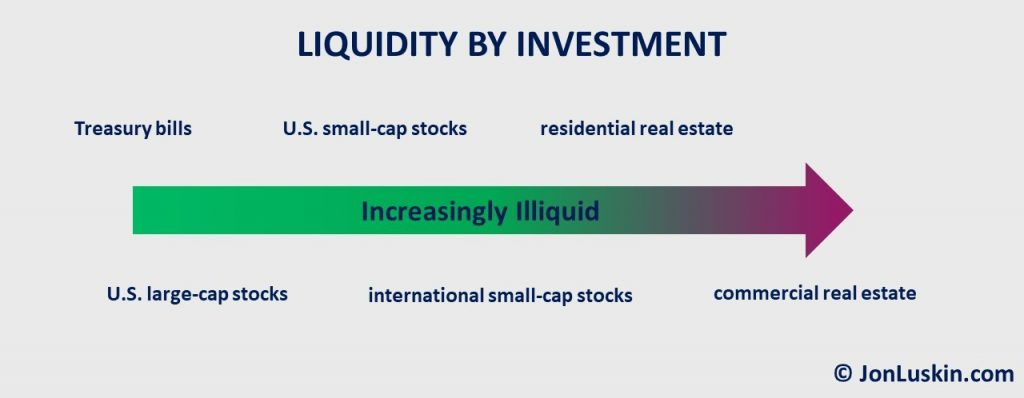
It’s the same for alternatives. Generally, they are relatively illiquid. In some circumstances (such as private equity), it can take years to exit a position.
Sometimes illiquidity confuses investors, being mistaken for low volatility.
What Is Volatility?
Since ETFs constantly sell throughout the day, investors can see at any moment how much those ETFs are selling for. This liquidity lets investors easily determine if those investments are increasing or decreasing in value. The degree to which investments change in value is their volatility.
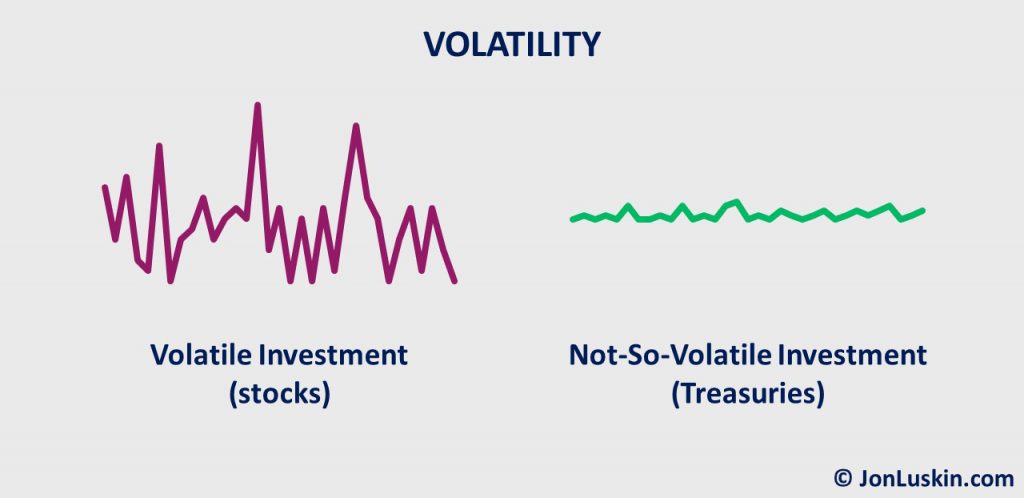
Investments that change a lot in value – such as individual stocks – are very volatile. High-quality bonds are less volatile. Ignoring inflation, cash has no volatility.
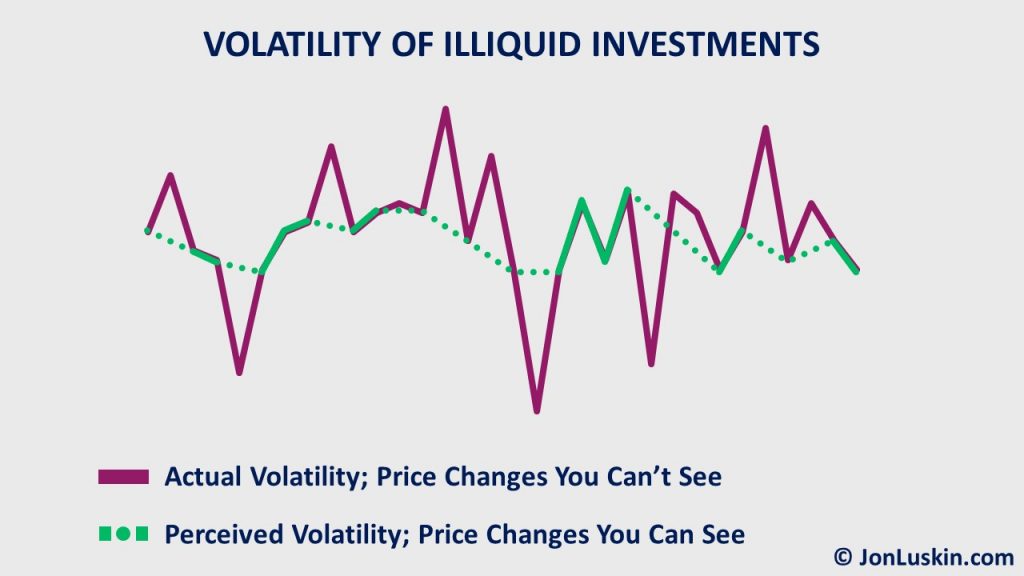
At the end of the last section, I wrote that illiquidity is confused with low volatility. How does illiquidity (the inability to sell something quickly) get confused for low volatility (an investment that doesn’t change much in value)? It comes from making assumptions when missing data.
Mistaki>Mistaking Missing Data of Alternatives for Low Volatility
enerally, alternative investments are illiquid and volatile, yet you can’t see the volatility. That’s because alternatives aren’t sold repeatedly throughout the day (unlike ETFs). So, no one’s reporting on how their prices constantly fluctuate.Since you can’t see the value of the investment often, you may mistakenly assume that the price is not changing. However, that’s not accurate. And yet, this mistaken assumption of “no price data = no price change” is where the diversification myth of alternatives begins.
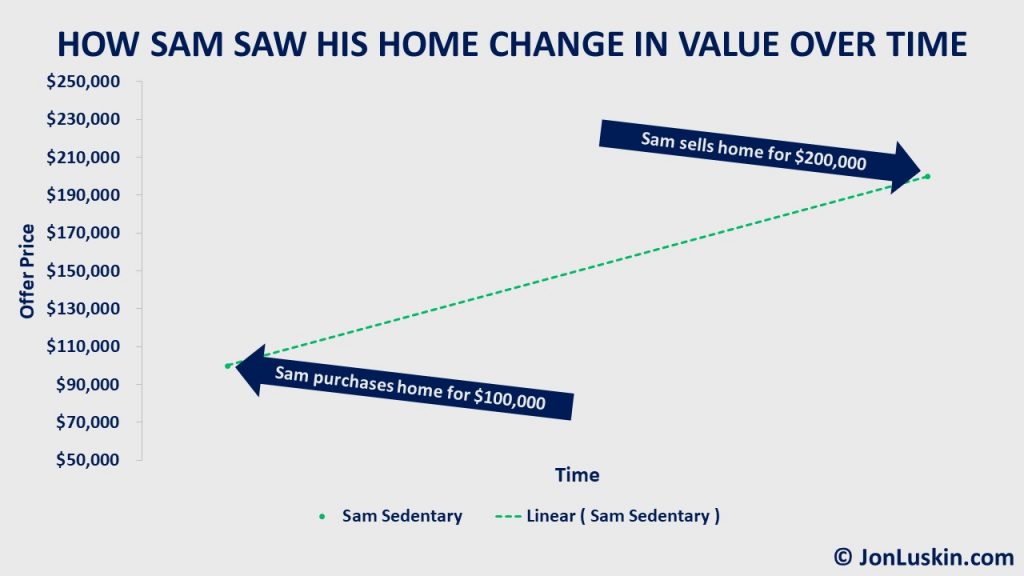
To explain how illiquidity gets confused for low volatility, consider an example: Sam Sedentary and Rachel Restless were neighbors. Sam and Rachel lived in identical homes, each simultaneously purchasing their respective home for $100,000. They lived in their homes for ten years, with each selling their home for $200,000 each in the 10th year.
Yet, Sam and Rachel went about the home sale process differently. Sam listed his home for sale only once: when he was ready to sell. Ultimately, Sam received one offer for $200,000, which he accepted.
Consider how to interpret that data: with limited information, the change in value of Sam’s home over those ten years looks like a smooth ride.
As mentioned, Sam waited ten years to list his home for sale. That wasn’t the case for Rachel; she listed her home for sale the month after she bought it, and kept her home listed for ten years.
Each month over those ten years, Rachel received an offer to buy her home. As you can imagine, the offer prices varied widely over time. Rachel received some offers greater than $200,000. Other times, offers were less than $100,000. Ultimately, Rachel – like Sam – accepted an offer of $200,000.
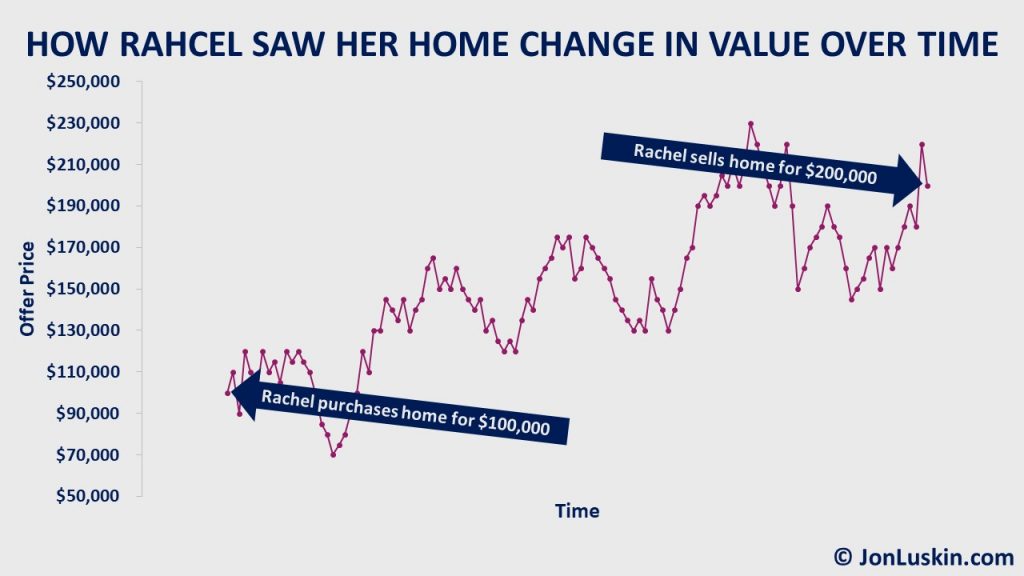
For Sam, he doubled his money and experienced no volatility along the way. That’s because Sam, unlike Rachel, effectively closed his eyes to the world around him. Prices were changing, yet Sam didn’t see those price changes. However, for Rachel, receiving new offers every month allowed her to witness the value change over time.
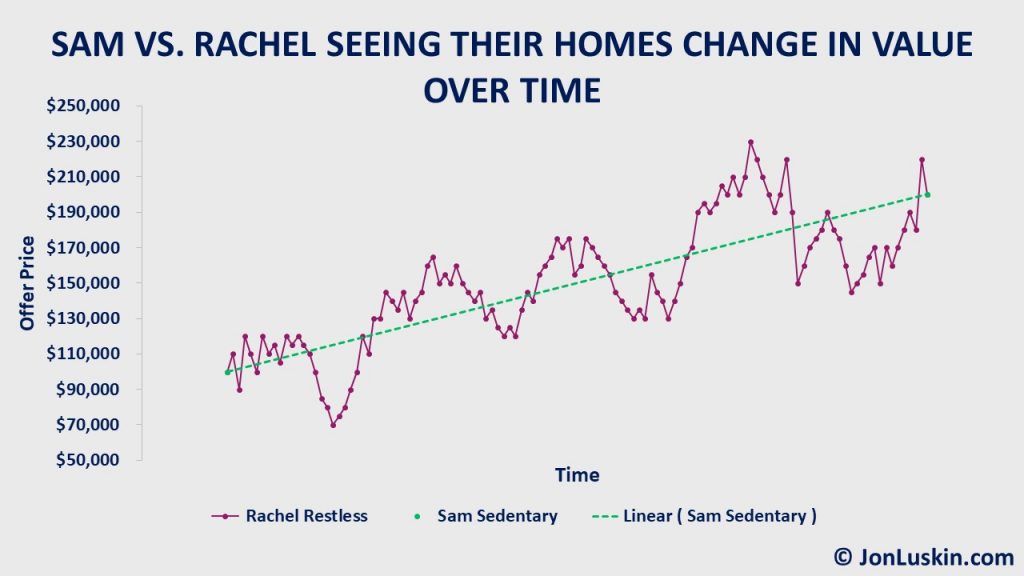
Both homes were illiquid, and both home prices were volatile. For Sam, the illiquid nature of the home hid price volatility. Sam assumed that his home was a stable investment, given the missing data.
It’s the same for alternative assets. Alternative assets don’t benefit from a continuous flow of price data. Absent that data, investors may wrongly assume they have a less volatile investment then they actually do.
Missing Data Makes Any Investment Less Volatile
Consider the performance of the S&P 500 during the 2020 coronavirus crash. Within that period, stocks lost roughly a third of their value. In the chart below, it’s difficult to miss that huge drop. Looking at a ~33% drop, you would conclude that the S&P 500 is quite volatile. And you’d be right.
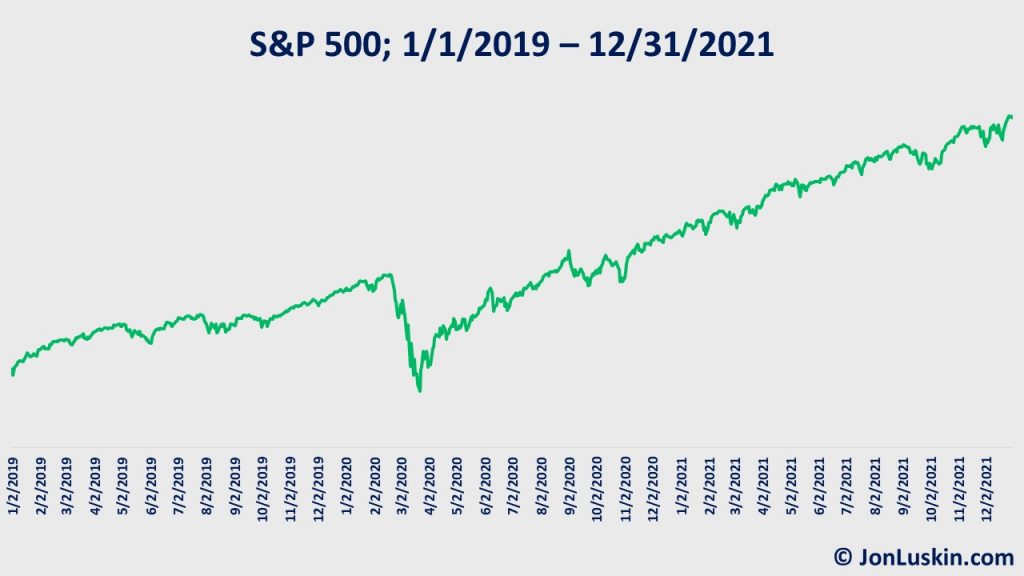
But, what if you didn’t have any data on the stock market during the coronavirus crash? You could assume it was business as usual, with the market continuing on its path. The investment performance would have looked very different in making that assumption, with the S&P 500 being much less volatile.
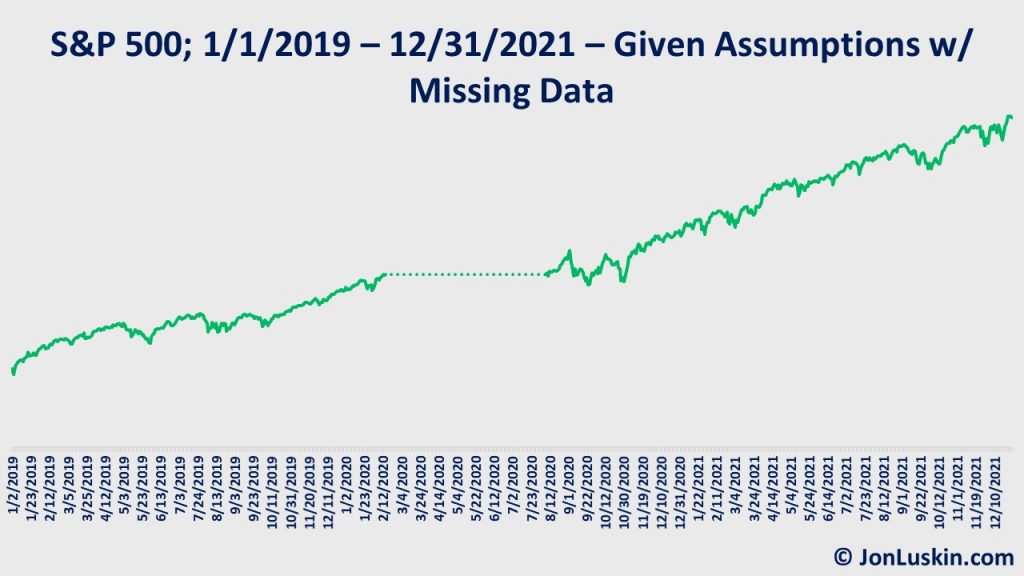
The second chart of the S&P 500 – without the coronavirus crash data – looks like a much more stable investment than the complete data set would suggest. Of course, it’s literally the same investment.
In short, it doesn’t matter if it’s alternatives or plain-vanilla stocks and bonds; if you assume no price changes given a gap in data, any investment is going to appear less volatile.
Mistaking Missi>Mistaking Missing Data of Alternatives for Low Correlation
it comes to assumptions made with missing data, the mistakes don’t end with assumptions of low volatility. Investors may also mistakenly assume low correlation with other investments.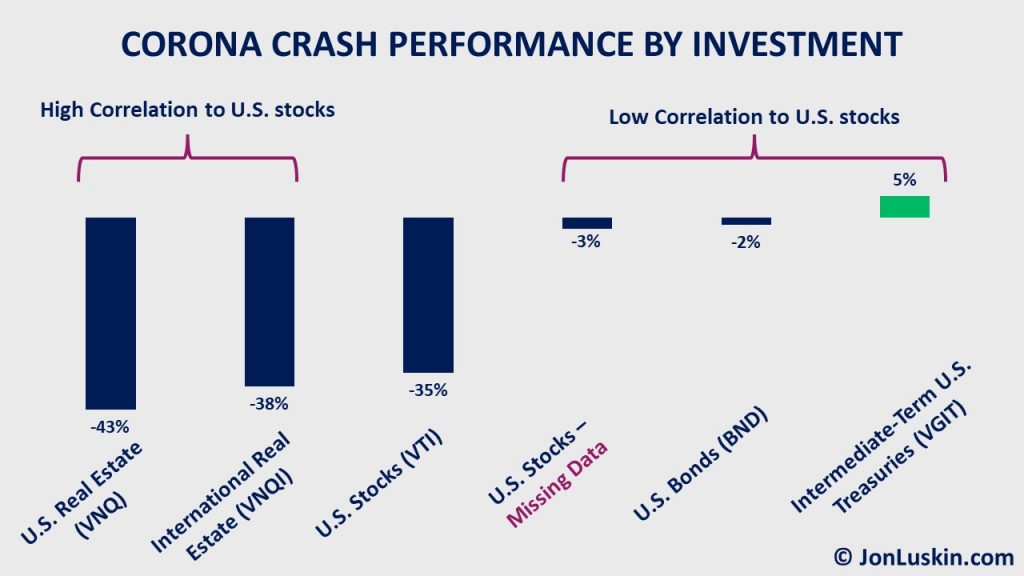
Recall that correlation is the degree to which two investments mirror each other’s movements. With missing data, you can compare the exact same investment to itself and have low correlation. Of course, that’s not actually low correlation; it’s just a mirage due to missing data.
Don’t Be Fooled>Don’t Be Fooled by a Misunderstanding of Missing Data (Illiquidity) of Alternative Investments; Stick with Low-Cost Index Funds
that, we’ve further debunked the sales pitch of private REITs and other high-fee alternative investments. The tried-and-true (and exceptionally boring) approach for successful investing remains the same:- keep costs low
- diversify
- stay the course
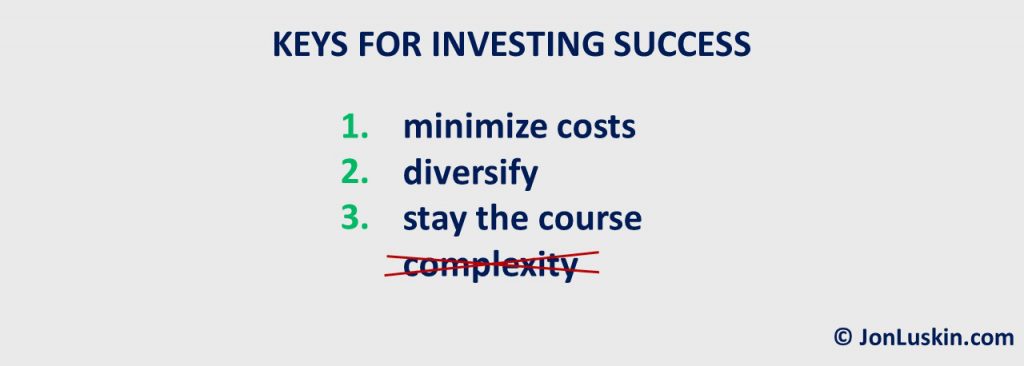
Alternative investments fail the first test: low-cost. Moreover, this post shows that the diversification benefit of alternatives is actually a misunderstanding from missing data, and how that missing data leads to false assumptions about volatility and correlation. That’s why skipping high-fee alternative assets has been shown to produce better investment results. Smart investors do just that.
One refinement I would call out is that two investments can be highly correlated but move with different magnitudes. High Beta stocks might be highly correlated with the overall market but move twice the magnitude; low Beta stocks might be highly correlated with the overall market but move half the magnitude. To be correlated means that the investments tend to move in the same direction, regardless of magnitude.
I won’t disagree with that.
For this article, the important takeaway is that any correlation benefit of alternative assets is a mirage; investors should focus on keeping their costs low.
🤓
A brilliant reminder, thanks Jon!
What worries me is how the ‘new alts’ (art, farm, wine, etc.) use their illiquidity for marketing. With the typical trifecta: strong performance, low correlation, low vol, and produce stunning charts that can easily fool the non-initiated.
Thank you for the kind words, George.
Indeed. That’s the issue.
One can hope that those being pitched these products can remember the old adage:
If something is too good to be true, it is.
Well put. Thanks for detailing this out.